Gas Index of Customers Documentation
Driver Description
The Gas Index of Customers captures information from FERC Forms 549B and Form 2 and 2/3Q financial filings to give a comprehensive view on customers, contracts, projected volumes, and actual volumes for natural gas pipelines and storage operations.
- Industry: Gas
- Sub-Industry: Gas Transmission/Transport, Gas Storage
- Data Timeline: Quarterly
- Geography: US States
Data Sources
FERC Form 549B - Index of Customers
FERC Form 2 and 2/3Q - Annual and Quarterly Financials
- Page 299: Monthly Quantity and Revenue Data
Usage
The Gas Index of Customers driver focuses on combining volume and revenue data around contracts signed between FERC-regulated gas storage/pipeline companies and shippers, the projected quarterly maximum volumes associated with those contracts, and how much companies are earning based on the rate schedule of the contracts.
Key insights can be gathered on which contracts are set to expire between respondent companies and shippers, whether contracted volumes are being fully-utilized in reality, and how volumes and revenues are changing from quarter-to-quarter.
Company Overview
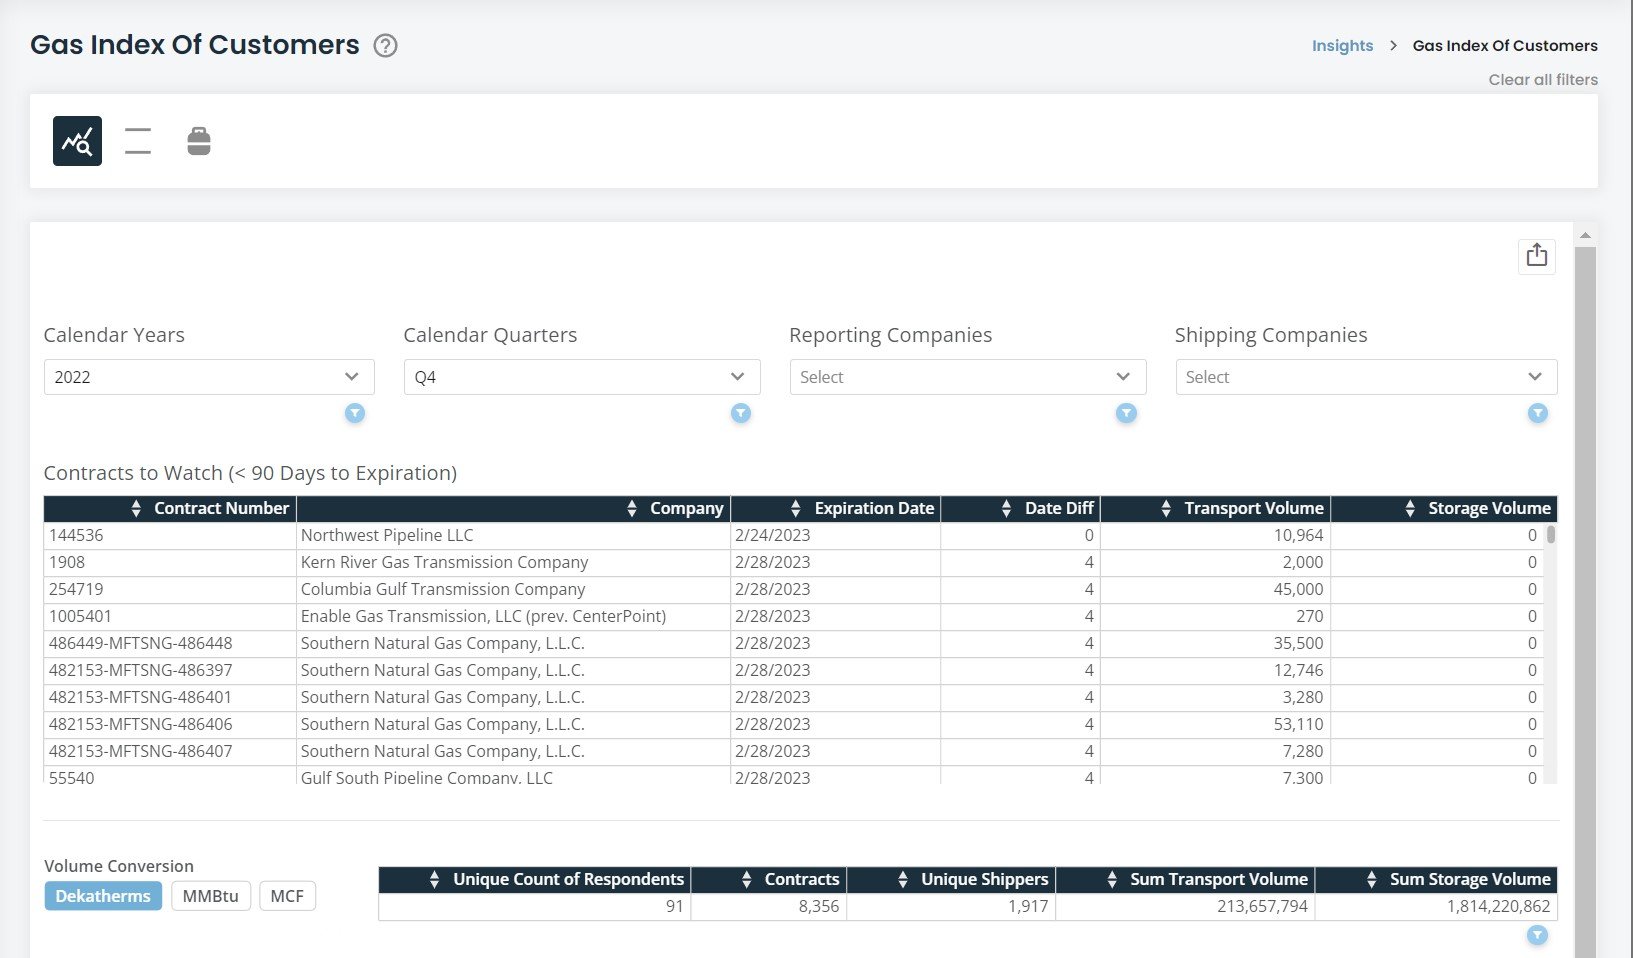
Contracts to Watch
The Company Overview has several components to it. The first table you will see is a running list of contracts that are set to expire within the next 90 days. This is an active table where the days to expiration is updated daily and new contracts included every quarter. Contracts that are expired are thrown out to keep the list clean and relevant to watch list. Below this, you will see a summary table and a volume conversion feature. The summary table is impacted by the filters at the top of the screen, giving you a quick view of the total scope of data you are looking at.
Volume Conversion
The Volume Conversion feature is present throughout the entire driver and allows you to convert between volumes reported in the 549B. The three most common measurements are Dekatherms (Dth), Millions of British Thermal Units (MMBtu), and Millions of Cubic Feet (MCF). We have converted those to allow you to view any volume number from any of the three. Dekatherms and MMBtu are 1-to-1 within this driver while MCF multiplies Dth and MMBtu by 1.037 according to conversion standards set by the Energy Information Administration.
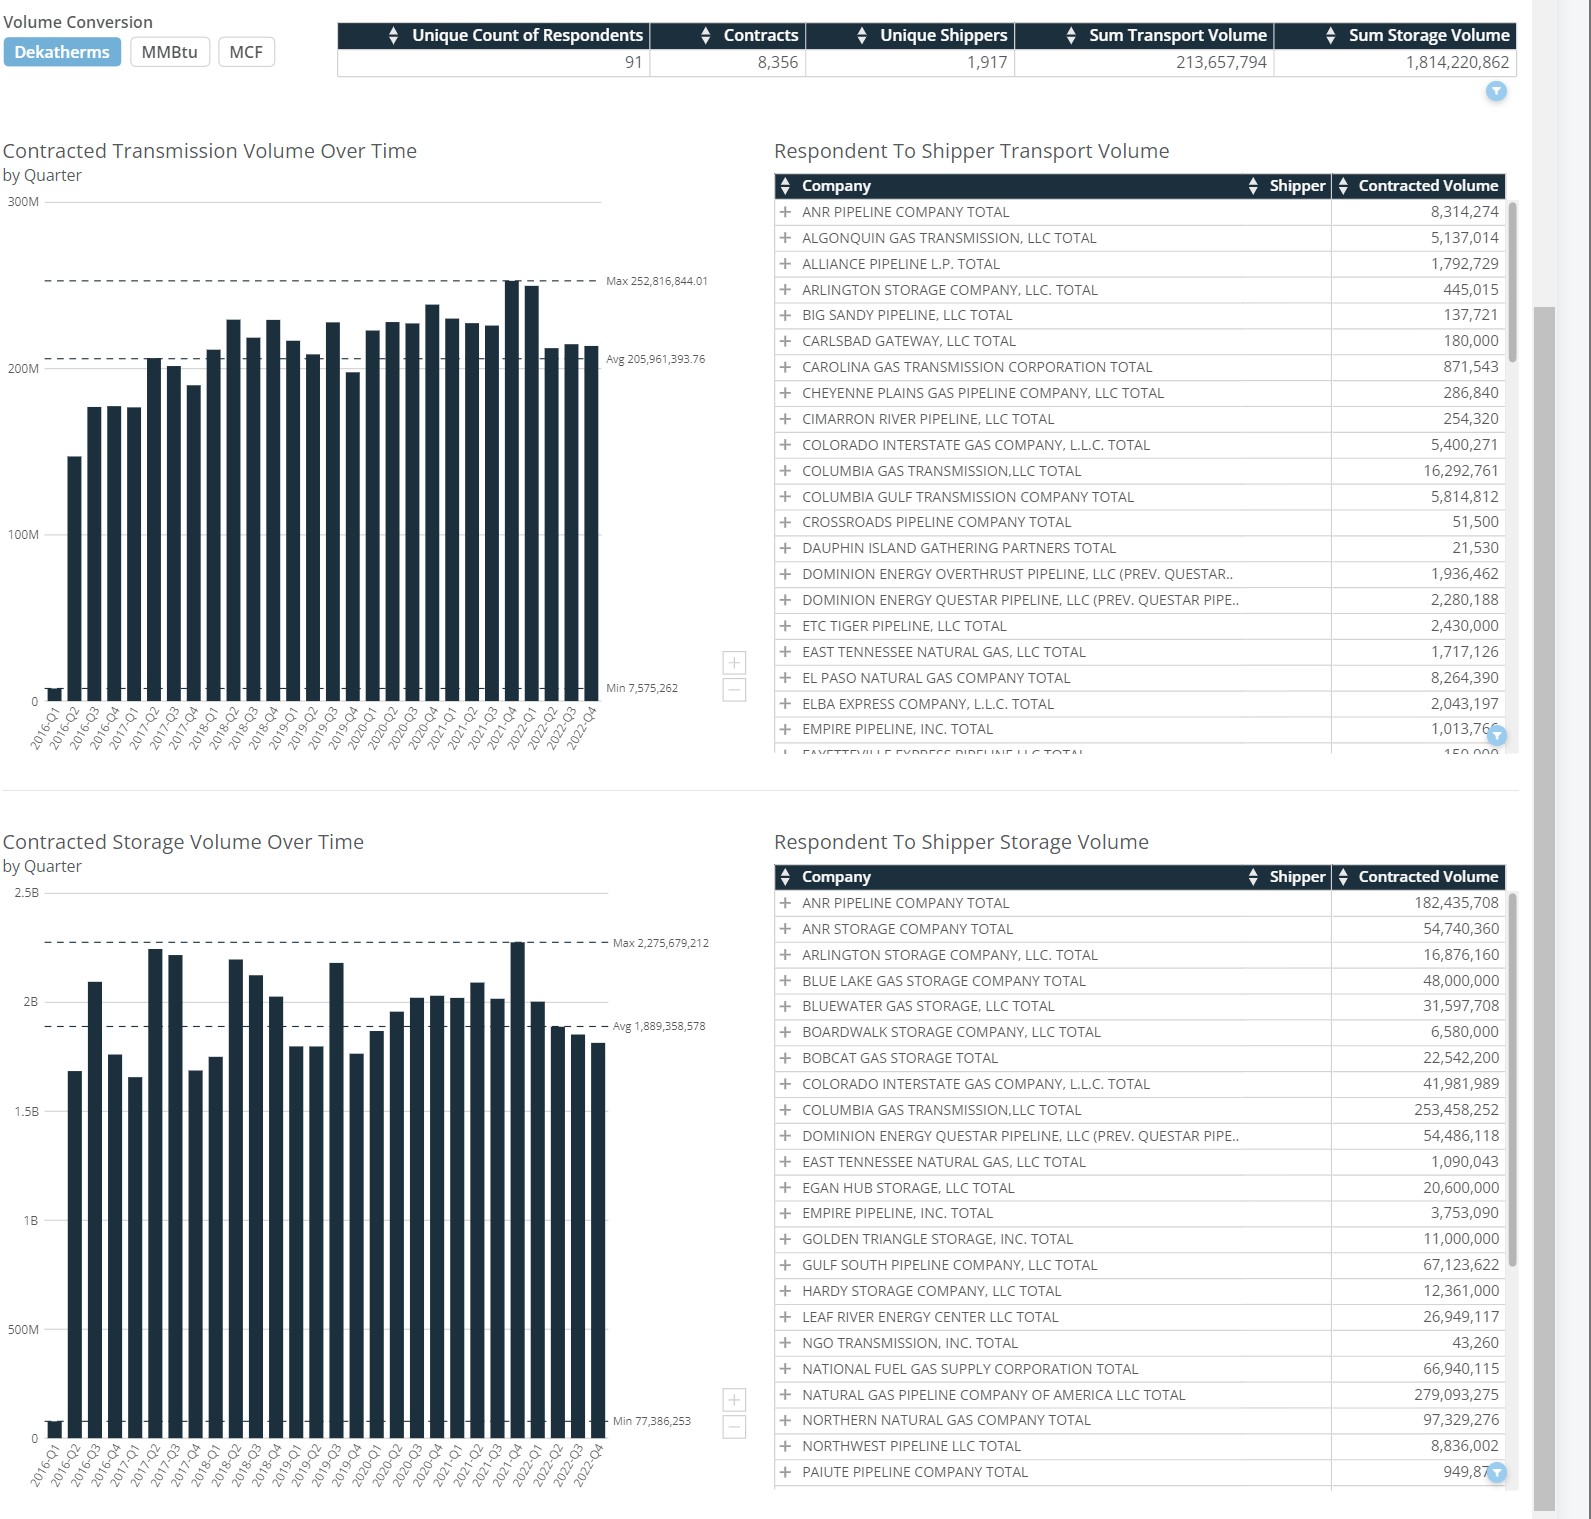
Volumes Over Time
There are two visualizations in the Company Overview page measuring the sum of contracted volume each quarter. The visualizations will default to showing all companies in the view but changing the shipping company or reporting company will adjust the visualizations to focus on what companies you choose. The top visualization focuses
Respondent to Shipper Volume Tables
The two tables are similarly split between transport/transmission volumes and storage volumes by looking at each reporting company in the latest quarter. Clicking the "+" icon next to the company name will drill down to show all shippers the company contracted with and the sum of volume between those companies between all contracts. For example, if ANR Pipeline had three contracts with Allerton Gas, the sum of those three contracts would be in the "Total Contracted Volume" column in the drill down.
Navigating to Transmission and Storage Tables
Specific Contract Information, Projected and Actual Volumes, and Zones/Points are located in two other sections within the driver. You can navigate to these sections via the icons at the top of the screen ![]() The left-most icon is the company overview; the middle is transmission/transportation tables, and the right-most icon are storage tables.
The left-most icon is the company overview; the middle is transmission/transportation tables, and the right-most icon are storage tables.
Transmission and Storage Tables
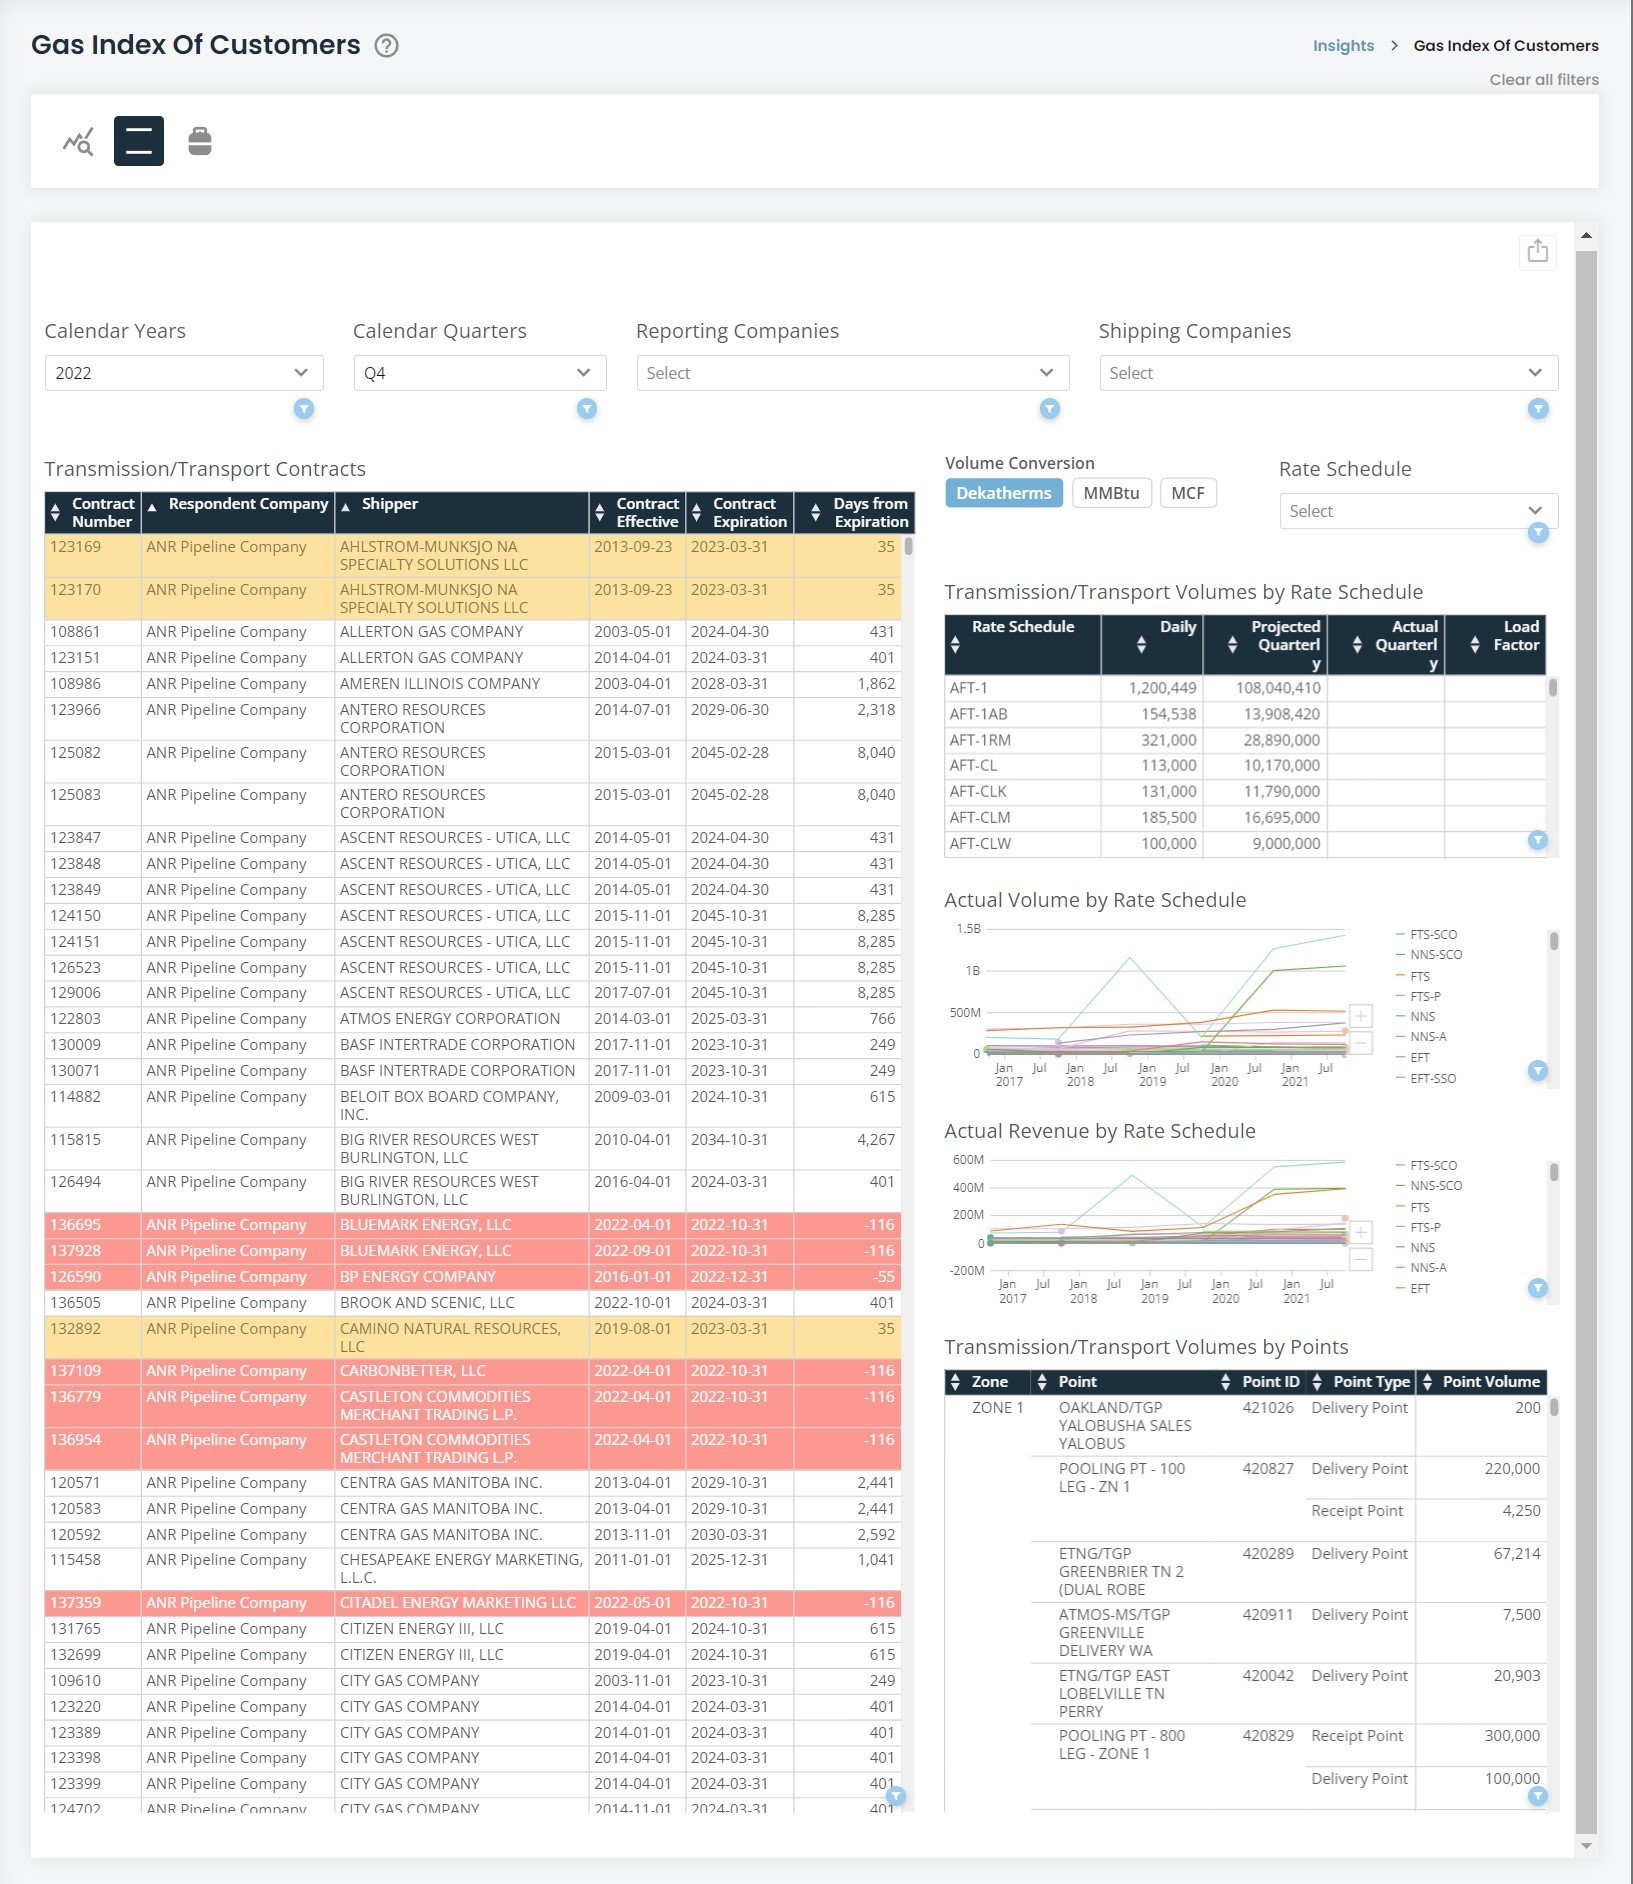
DISCLAIMER: Both the transmission and storage tables are designed the same and contain the exact same features. We will use the transmission table section as the documented example but anything we show you here will apply equally in the storage section of the driver.
Transmission/Transport Contracts
This table lists all contracts reported by FERC-regulated companies based on the calendar year and/or quarter you select. The filters will default to show the most recent reporting period. The table includes the reporter, shipper, contract number, when the contracted started, expiration date, and the days from expiration. You can sort by any of these columns to narrow what you want to look at. There are also certain contracts highlighted within the table. Records with a yellow highlight are contracts that will expire within 90 days while red records are contracts that have already expired within the past 90 days.
Clicking on any contract will filter the other tables and visualizations in the driver to bring contextual information on the selected contract.
Transmission/Transport Rates
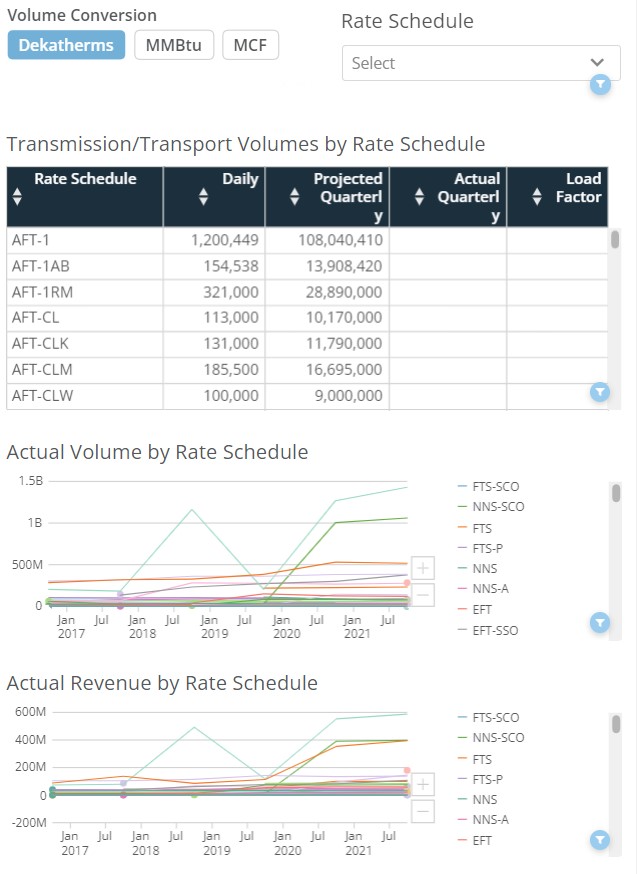
This table focuses on the rate schedules associated with particular contracts. The table defaults to the sum of volumes between all contracts depending on the reporting periods and/or companies you select from the filters. For example: filtering to 2022 Q4 and ANR Pipeline will show the total volumes for each rate schedule. Clicking in a single contract from the contracts table will show you the specific rate schedule and volumes for that contract as reported verbatim in the 549B.
There are four columns of information for each rate schedule. "Daily" is the as-reported maximum daily volume contracted. Selecting multiple contracts or an entire company will sum the maximum contracted volumes. "Projected Quarterly" is the potential maximum volume multiplied by 90 to simulate how much can be transported in that quarter on that particular rate.
"Actual Quarterly" is the as-reported number from the FERC Form 2 and 2/3Q from page 299. This represents the real-world volume that was transported in that reporting period on that rate schedule. Due to the nature of the FERC Form 2 data, the "Actual Quarterly" is representative on the company-level rather than the contract level. If you select a particular contract, the total actual volume will still be present representative of the entire company.
"Load Factor" is the percent difference of the "Projected Quarterly" and the "Actual Quarterly" numbers.
An important note on these datasets: there will always be a two quarter delay between the 549B and the Form 2 and 2/3-Q. The 549B is a "forward" looking report talking about the upcoming quarter, while the Form 2 and 2/3-Q are "retroactive" meaning it looks back at the previous quarter. The system will default to the latest quarter filed in the 549B, but seeing Form 2 data will require selecting two quarters ago.
Actual Volume and Revenue Visualizations
Below the rates table are two visualizations that show historical data on actual volumes and revenue by rate schedule as reported in the Form 2 and 2/3Q. Hovering your cursor over the rate schedule in the Transmission/Transport Rate table will call-out that rate schedule in the two visualizations. You may also use the rate schedule filter above the tables to narrow all the tables in the driver along with the visualizations. This again favors looking at rate schedules on a per-respondent company basis.
Transmission/Transport Points
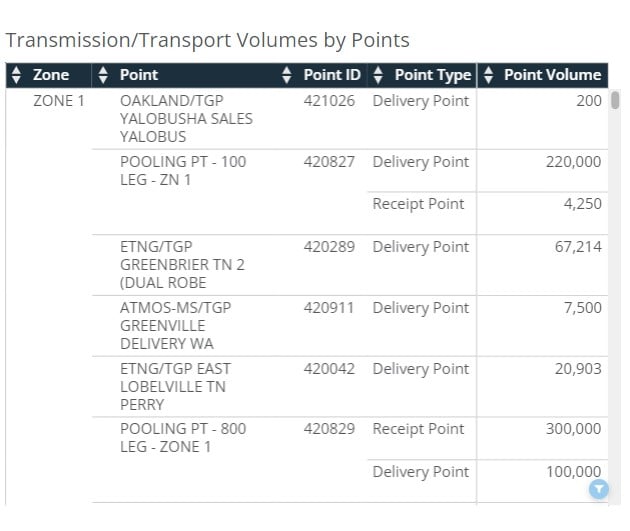
Each contract usually has several points where gas is delivered, received, stored, or withdrawn. This table focuses on showcasing those points, organized by zone, for particular companies and/or contracts. Clicking on a contract in the contracts table will show you the particular points under that contract along with their zone location, ID, point type, and volume for that point. For the most part, the total delivery points to receipt point volumes should be equal to each other (i.e. if Delivery Point 1 has 1000 dth and Delivery Point 2 has 2000 dth, then Receipt Point 3 should have 3000 dth).
Exporting Visuals and Data
There are several ways in which the driver can be exported. A visual export of the driver via PDF or PowerPoint can be generated via the export button () at the top-right corner of the driver. Data can be exported via each card on the driver. To export data, move your cursor over the card/table and another export (
) button will appear at the top-right of the card/table. The data will export into a csv file in a long-table format. An additional feature is the expand details icon on each card. Hovering your cursor over a card/table will show the expand details icon (
). The expand details icon will give you a screen as seen below.

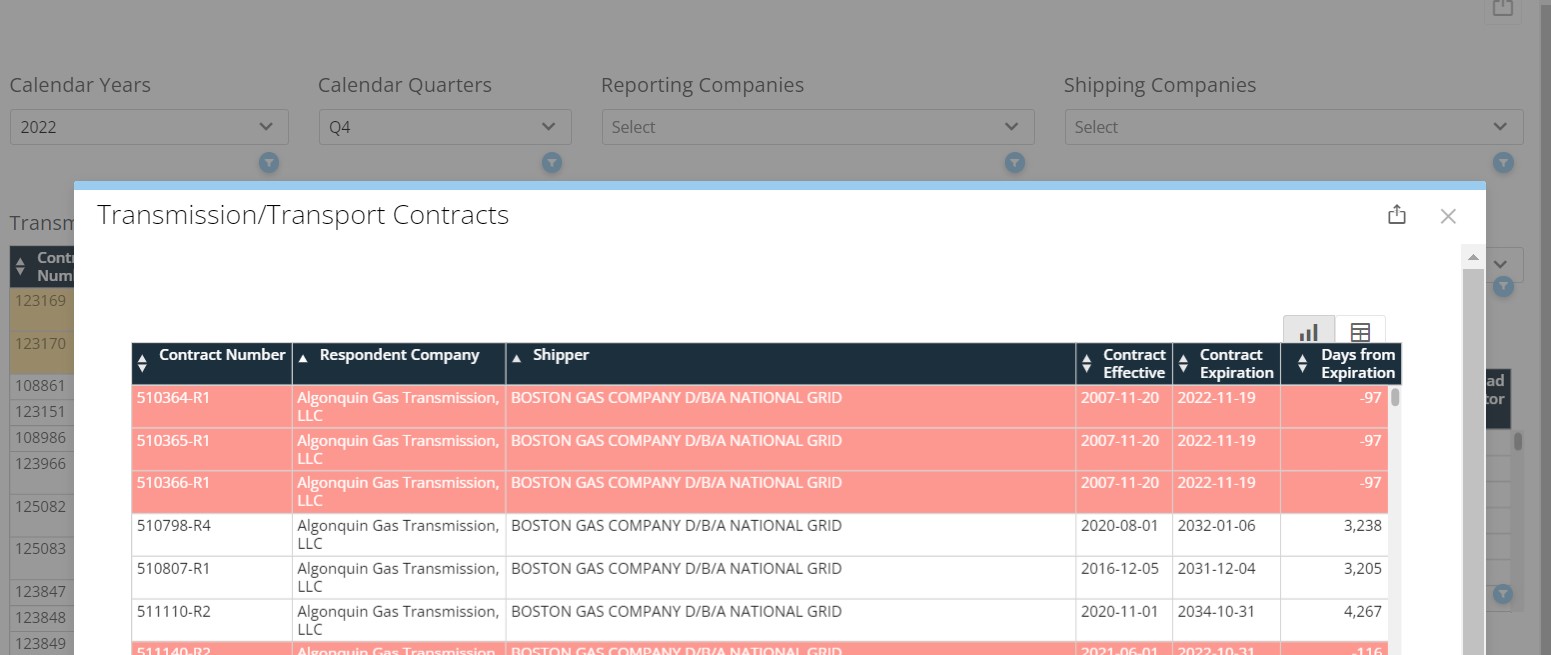
Once you click on the expand details icon, a screen will pop-up giving you a few options to interact with that particular card. You can click on the export button at the top-right of the pop-up to export the visualization either in a visual format or the data behind the visualization via CSV or Excel. Clicking the table icon
at the top-right of the pop-up will show you the data feeding into the visualization.