Term Search Bar
The search bar is very simple to use.
Similar to when you search the web in your internet browser, the Gateway search bar responds to your search with results that are based on the wording of the term that you typed into it.
There are many terms in the queried dataset that have similar names or even share an exact name across different forms and filings. It is recommended you narrow the list of terms by industry and/or form, then type a term in the search bar. The resulting list of terms will filter below the search bar and may be selected.
Figure 1: Term Search Bar

Industry and Form Filters
The industry and form filters are useful tools to narrow the scope of terms visible within the view.
There are over 8,000 terms at the current count of the dataset. Finding one by scrolling is a bit like looking for a needle in a haystack. Utilizing these filters will be key to finding the correct terms for your analysis quickly.
The industry filters follow the energy types of oil, gas, and electric, and also map onto the various forms and reports HData pulls data from.
For example, selecting electric will narrow the list of terms to only show terms from electric forms. In this case, it will include FERC Forms 1, 1-3/Q, and 1-F. You may narrow this range even further by using the Form filter to only select terms from Form 1-3/Q. You may also go straight to the Form filter if you prefer without specifying an industry.
Figure 2: Industry and Form Filters

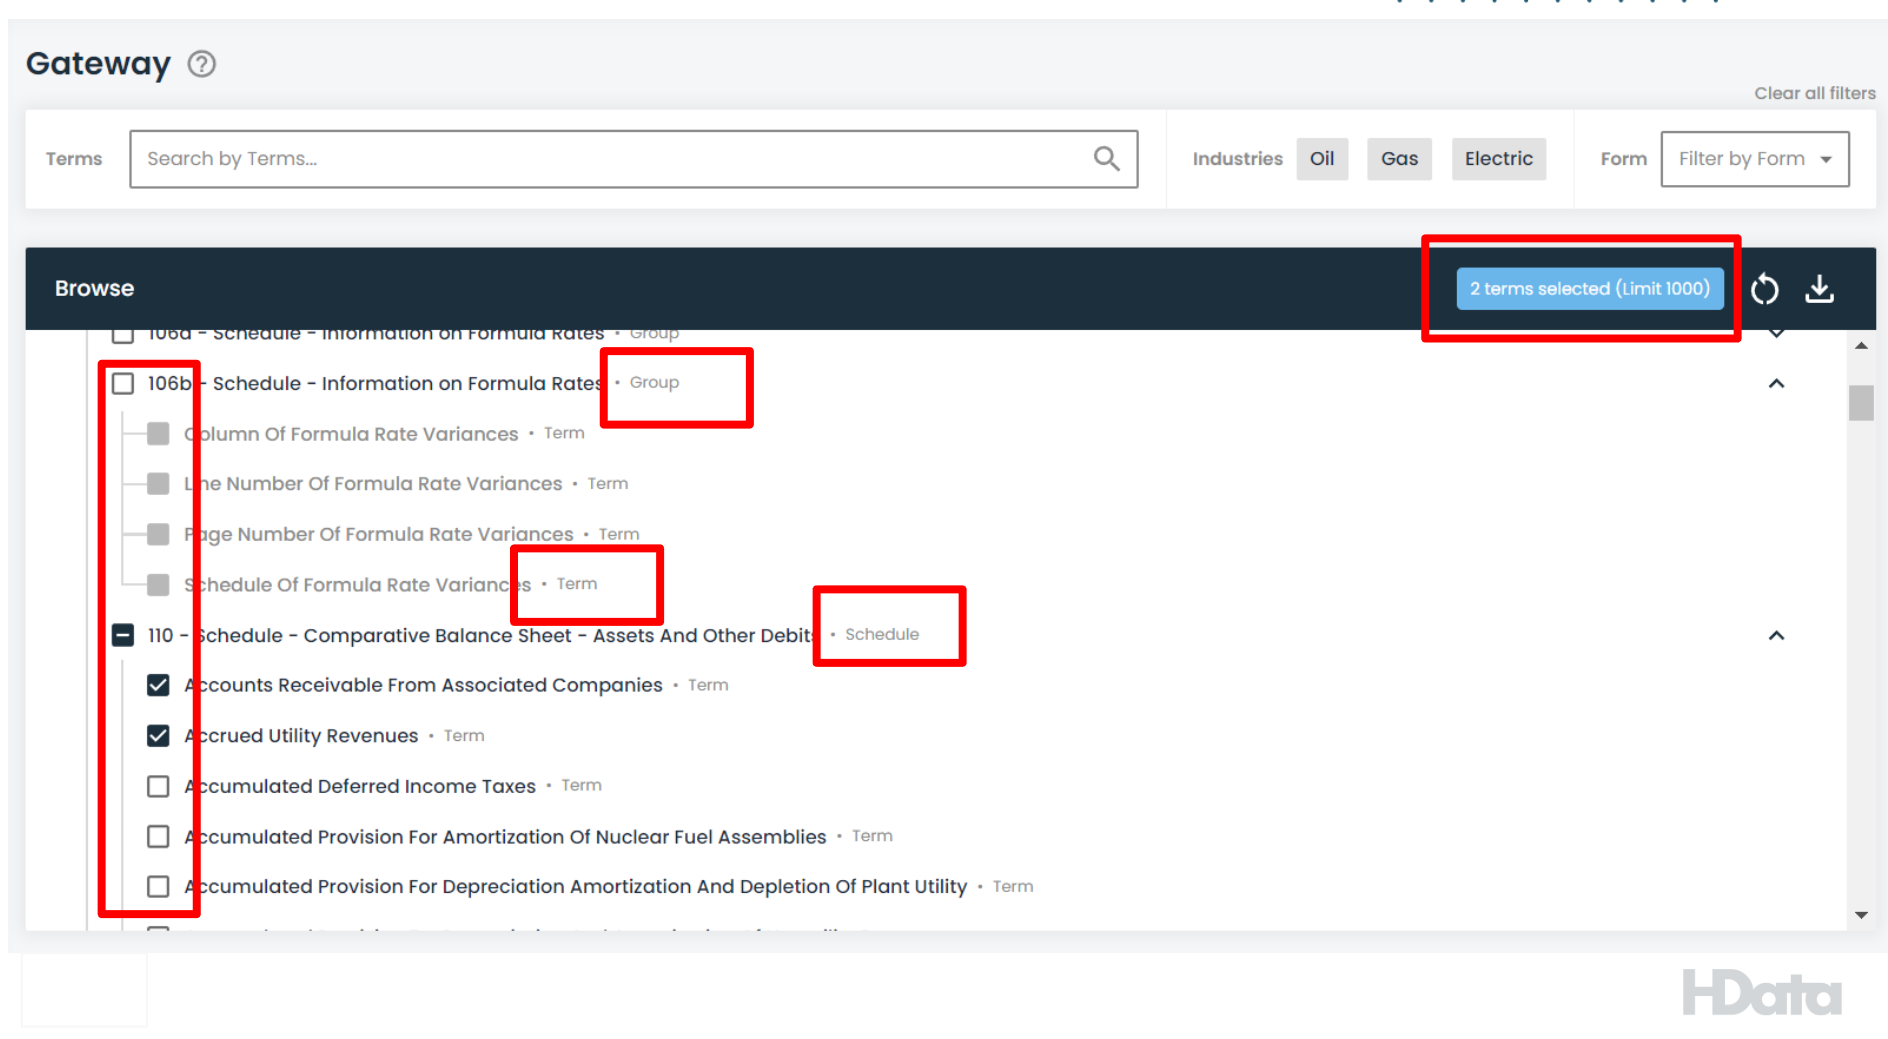
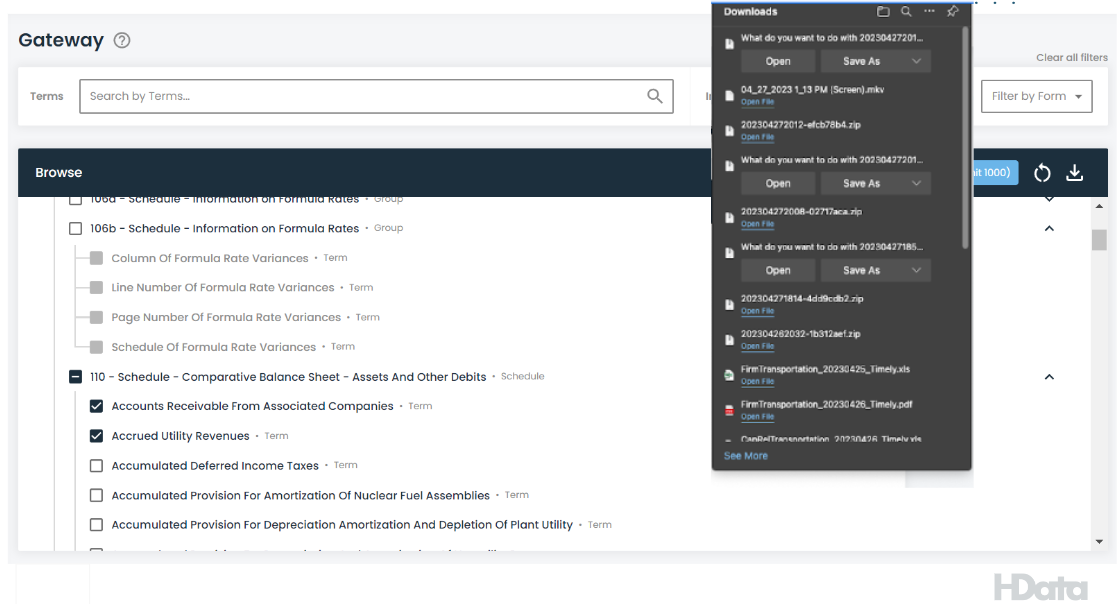
Term Browse/Selection
You may also browse the list of terms by form and schedule.
As seen in the screenshot above, the forms are organized in a branching structure. Clicking on the arrow to the right of the form or schedule will open the list of terms underneath it. Selecting the box next to a form or schedule will select all the terms underneath it. Note that there is a 1000-term limit to the data export, so selecting an entire form will prevent downloading it.
You can narrow the list of forms available in the view via the Form and Industry filters at the top of the screen. Given the similarity (and even use of identical names of terms) on similar form types, many terms and forms are collapsed.
In the case of Form 1 in the snapshot above, terms are shared between the Form 1, 1-3/Q, and 1-F. The differentiating factor of the forms is the time periods they report on. Selecting "accrued utility revenues" will pull that term for all forms. Specifying in the download that you want quarterly, quarterly cumulative, or annual, will pull that term from the respective form (1 for annual, 1-3/Q for quarterly, and quarterly cumulative).
You may notice different categories of terms when you browse Gateway. There are three main categories of terms: 1) Schedule, 2) Group, and 3) Term.
- Schedule is the unit in the Form where all terms based on a similar topic are kept together. For example, the schedule “Statement of Cash Flows” in the FERC Forms means that all the terms under it are within that schedule and related to cash flow information. You can select either a single term in the schedule, or the entire schedule.
- Group is similar to schedule, but they house special terms that must be kept together in order for the data to make sense. These special terms are what we call “multi-value terms,” meaning a single term may be repeatedly used in a dataset to describe different data points from a single company and time period. This is different from a regular term which has a single value in the dataset relative to a company and time period. Selecting a “Group” will result in an additional sheet being downloaded in your excel output. More information on this is described in the “Download” section.
- Term is the individual line item or row in the dataset you are selecting. This means that there will be a single value for a single company and time period when you download the data. The exceptions are the special terms under “Group” as described above. A large majority of data points in Gateway fall under the simple single term.
As you select terms, a light-blue box will appear in the toolbar at the top-right of the screen. This shows you how many terms you have selected relative to the system-permitted limit.
Figure 3: Term Browse/Selection
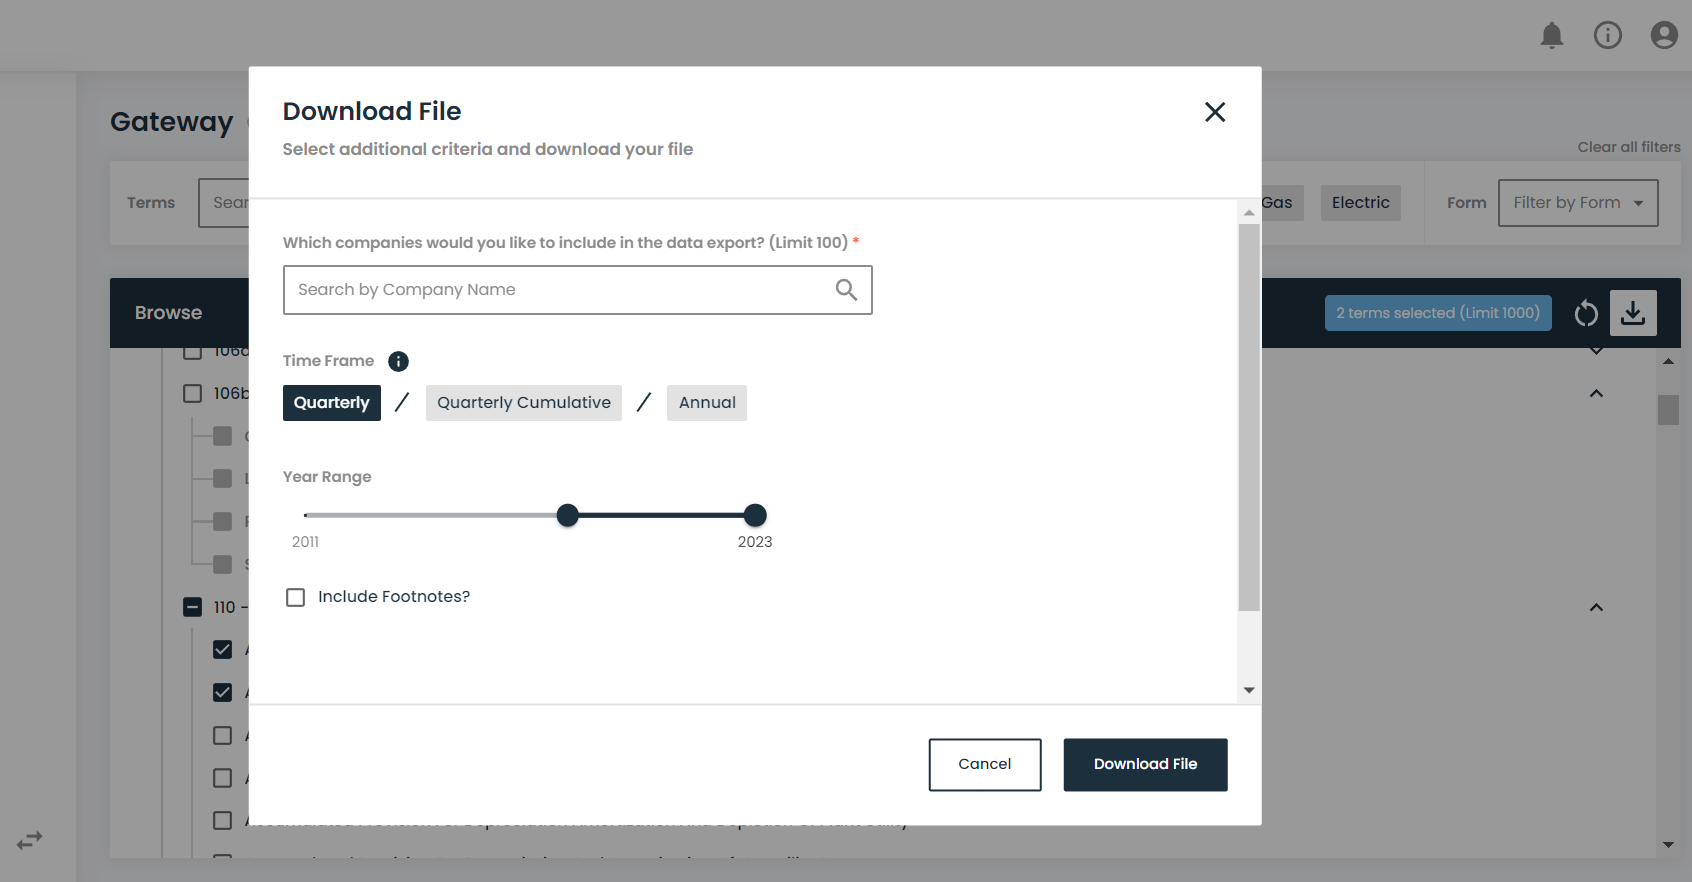
Download
Once you have selected the terms you want, click on the download icon at the top-right corner of the screen.
This will show a popup with several dimensions you can include in the data download. The text-search bar allows you to select a list of companies to include in the download. Time Frame focuses on the time period of data to include.
In the snapshot below, quarterly is selected. The as-reported number for the quarter will be included. Quarterly cumulative is the running sum of quarterly numbers for each quarter (i.e. Q2 = actual Q1 + actual Q2). In many datasets HData manages, the source data defaults to reporting the quarterly cumulative number. In those cases, HData calculates the actual quarterly number if "quarterly" is selected meaning Q2 actual = Q2 cumulative - Q1 actual. Annual data is the as-reported number for the entire year.
The Year Range narrows the selection to include the years needed for the download. If quarterly is selected between the years 2018-2022, that means the output will include quarters one through four for each year between 2018 and 2022. The checkbox at the bottom of the popup is an optional selection to include footnotes in the output. If selected, the output will be downloaded as a zip file with one folder being the csv of data, and another folder hosting .html files with the footnotes. Hyperlinks are included in the csv file connecting the numbers to the footnotes, so the correct footnotes may be accessed through the csv.
Once you have made your selection, click "Download File" at the bottom of the popup window.
Figure 5: Download File Prompts
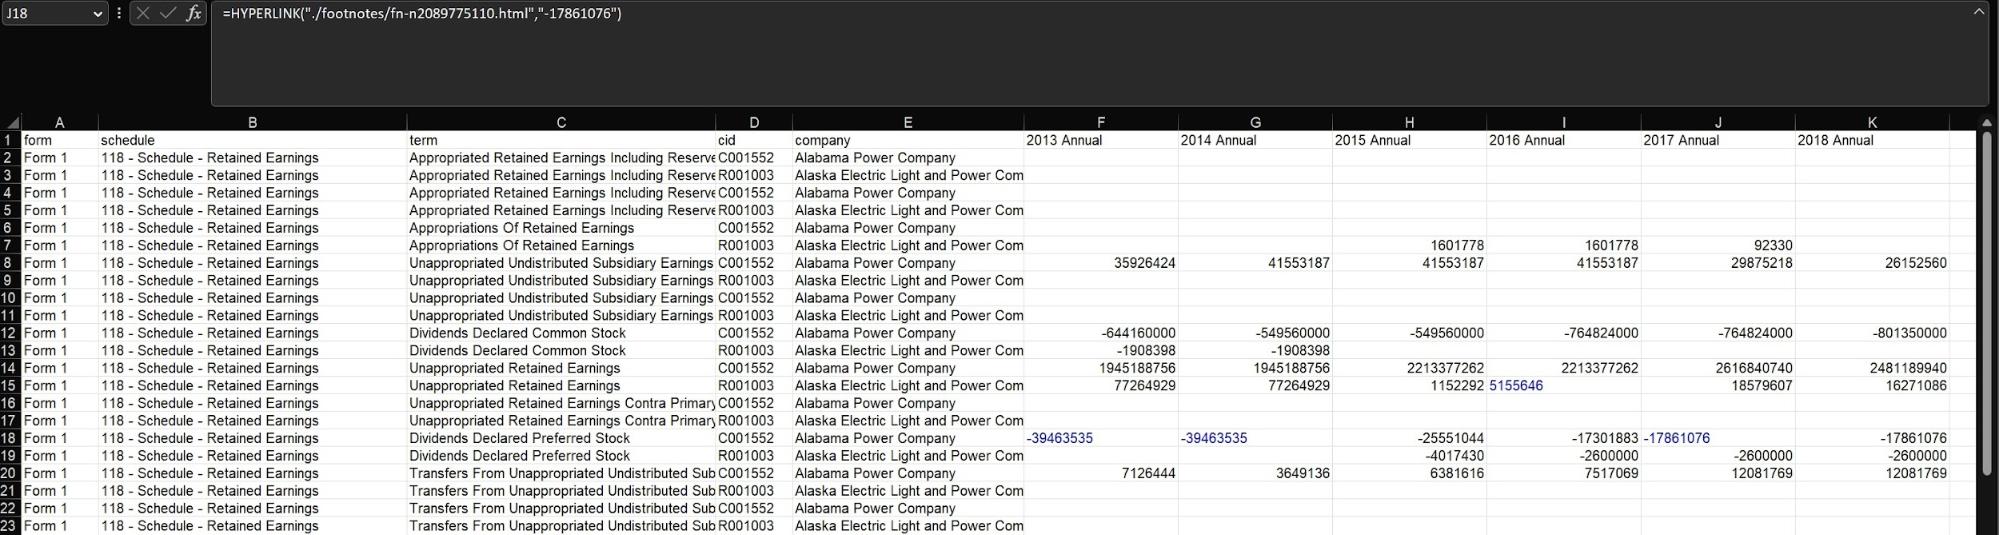
Output File
A download will occur automatically with your new data as a zip file. If you did not select footnotes, your folder will contain a basic excel sheet and a PDF file with Terms of Use and simple documentation of the data. If you selected footnotes, an additional folder will house the footnotes as html files.
Opening the excel sheet, you will see two tabs if you selected simple terms, or three tabs if you selected “Group” terms:
- HData Gateway Data
- Summary
- Group Terms (only appears if Group terms are selected)
- An example sheet name may be F1.S214 indicating Form 1, Schedule 214
The first tab is the data you specified in Gateway. The second tab is a short summary of the data sources and an indication about the last time they were updated. The last sheet will appear if you select Group terms. In the case of selecting only Group terms, the “HData Gateway Data” sheet will be empty while the Group Terms sheet will be populated with data.
If you selected footnotes to be included in the folder, you may see some numbers in the data tabs in a blue color with an associated hyperlink to them indicating it as an attached footnote. Clicking on the number will open your browser with the footnote content. There are steps you must take to ensure that this hyperlink is correctly associated with the number, this is explained below.
Figure 6: Output File Directory
Analyzing Footnotes via Windows
If you are using Windows, you can find your data under the "downloads" folder on your device. Once you have located your folder, you will need to extract the files into a new folder. Unless files are unzipped successfully, links between data points and the footnotes will be broken. To unzip the file, right click on the zip file and click on "extract all."
Figure 7: Analyzing Footnotes Via Windows
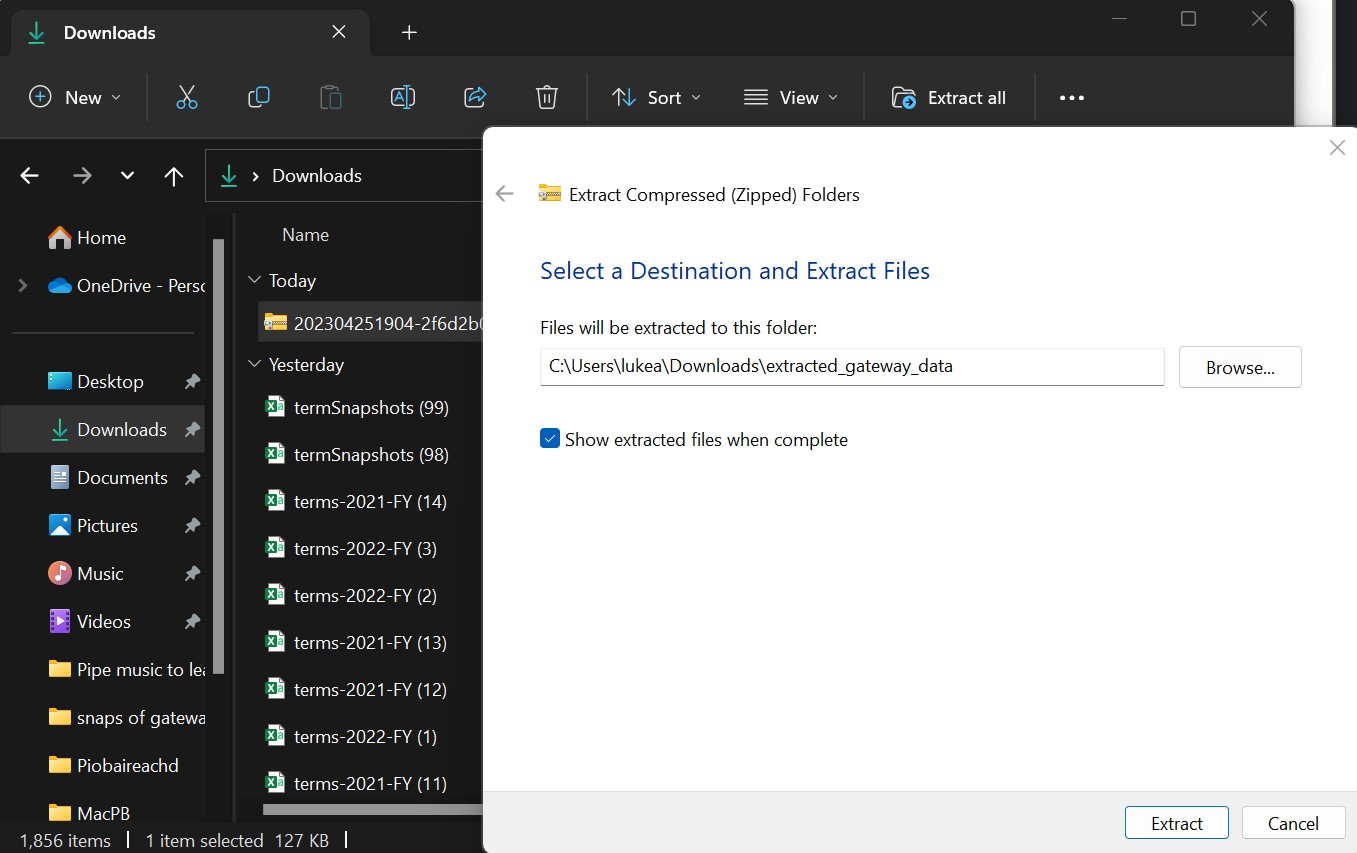
Clicking "extract all'' will give you a new screen where you can select where the contents of the unzipped folder will be saved. And you can give it a new name.
In this example, the user extracted the folder into their "downloads" folder and renamed it "extracted_gateway_data."
Clicking "extract" will correctly extract the data and ensure the hyperlinks between the footnotes and data in the excel file are maintained. You may now treat the new folder as explained at the beginning of the data output section.
Figure 8: Analyzing Footnotes Via Windows
Analyzing Footnotes via Mac/Apple
If you are using a Mac, you can find your data under the "downloads" folder on your device or as it pops up under "download." Once you have located the zip file, click on the zip file to open it.
Figure 9: Analyzing Footnotes Via Mac
You will see the folder with a subfolder holding the footnotes, the excel file, and a PDF description and Terms of Use for the data.
Clicking on the Excel file will show you the data with certain numbers highlighted in blue. This indicates that the number has an associated footnote. Clicking on one of these numbers will give you a popup screen like below.
Figure 9: Analyzing Footnotes Via Mac
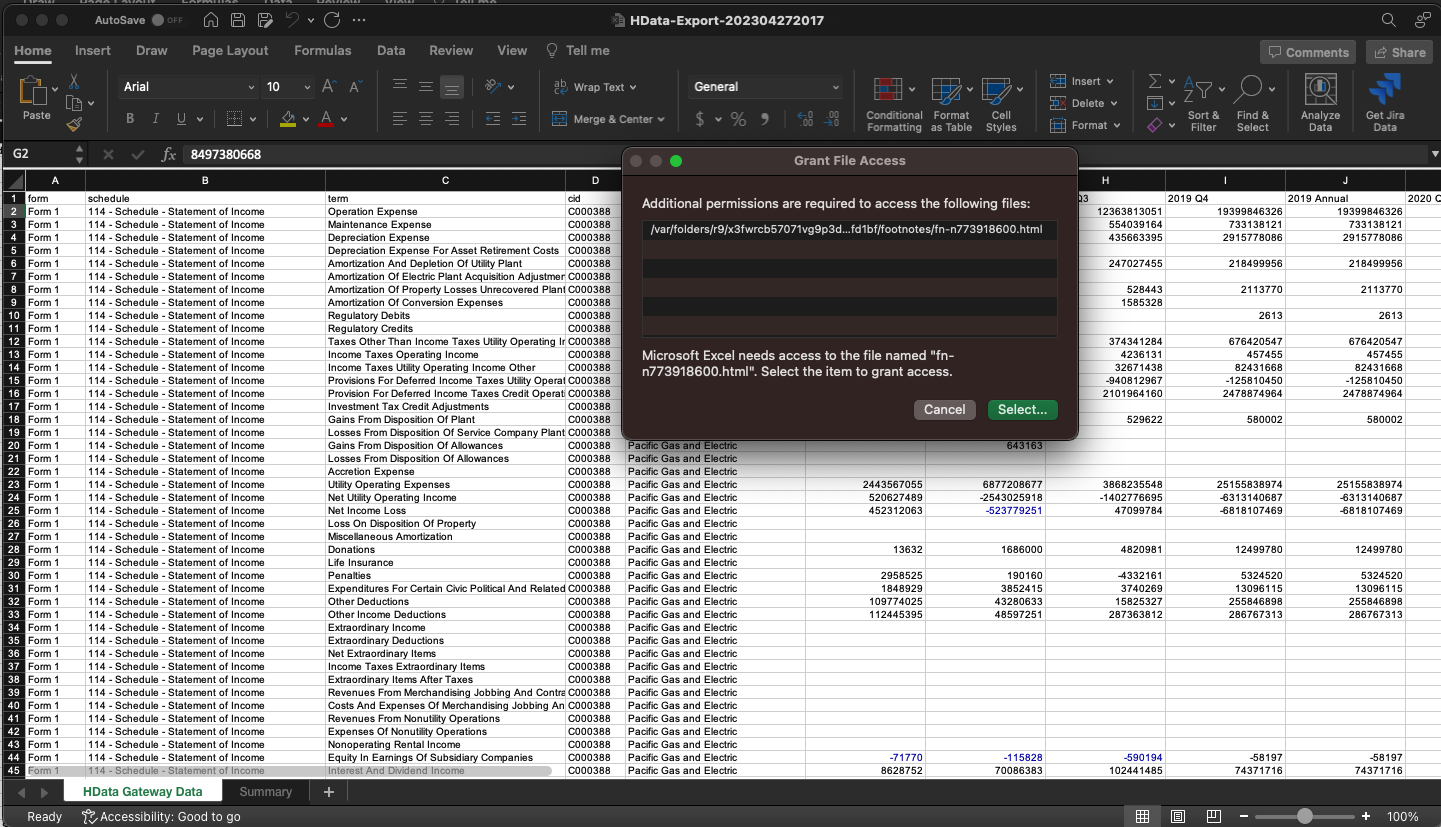
This will show the pathway from the number to the footnote folder in the associated zip file. Click on the green "Select" button.
Figure 10: Analyzing Footnotes Via Mac
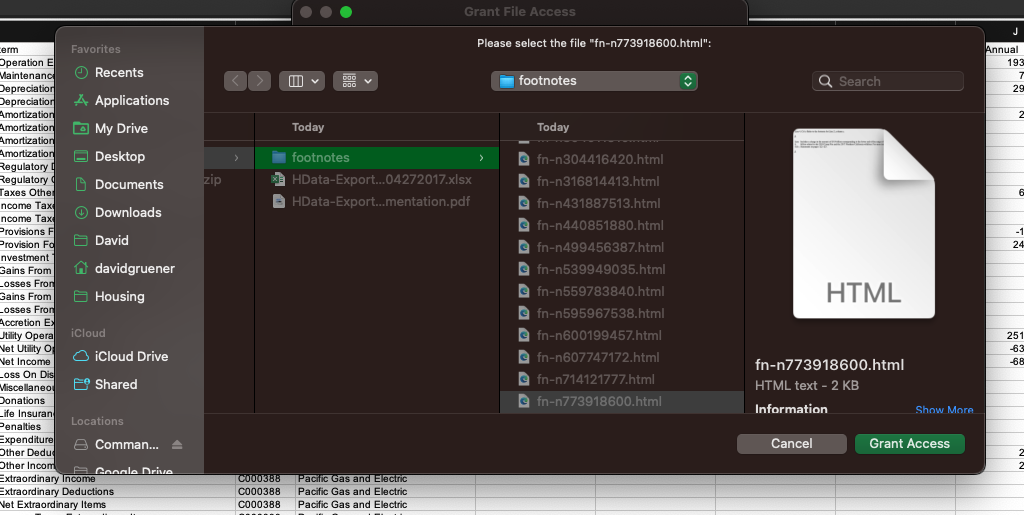
The correct footnote will automatically be selected, all you need to do is click "Grant Access." This will link the number with the footnote and also open the footnote on your browser.
Hopefully, this article gave you all the information you needed to be successful with the Gateway App. If you still need help, please reach out to us at support@hdata.us.