
Intelligence
AI-Powered Regulatory Document Analysis
Reduce the complexity, time, and cost of regulatory research and rate case preparation.

Accelerate Regulatory Visibility & Insights
Locate Regulatory Documents from a Central Library
Search and query federal, state, and other regulatory databases, and upload your own private documents
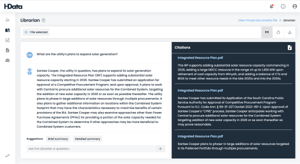
Uncover Answers Using Safe & Reliable AI
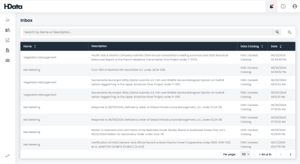
Receive Proactive Alerts


HData Intelligence Features
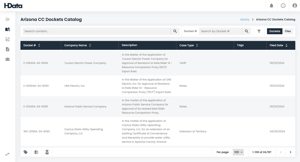
Advanced Document Search
Locate files from federal, state, and other regulatory sources by keyword search, docket number, and custom tagsDocument Comparison
View two documents side by side to see changes in text or numbers between versionsPrivate Document Library
Upload non-publicly available documents for confidential querying and analysisEmail & In-Platform Alerts
Customize alerts about companies, topics, or keywords when they appear in specific dockets or reportsCitation Display
View the underlying information used in AI-generated responses in real time as you receive answersVisual Citation Verification
Download queried source documents with a visual markup of where source information is located
EBOOK
How to Write Great Prompts for Regulatory AI
HData’s Regulatory AI is the first-ever artificial intelligence technology purpose-built to empower analysis of regulatory data. Learn what types of questions you can ask Regulatory AI and get tips for framing your prompts.