
Analytics
Energy Reporting & Raw Data
Customize millions of data points to gain faster and deeper insights on operational and financial performance of utilities and pipeline companies.
Access Centralized Energy Data for Benchmarking & Market Analysis
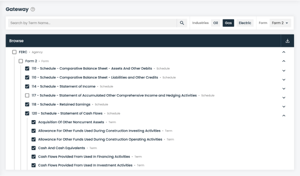
Leverage Comprehensive Data from FERC & EIA Filings
Reduce manual data collection by using a fully digitized suite featuring pre-built reports and the power to design your own ratios and custom calculations.
Customize Calculations & Visualizations
Export Raw Data to Your Systems & Models

Power & Utilities
- Income Statements & Balance Sheets
- Operations & Maintenance Expenses
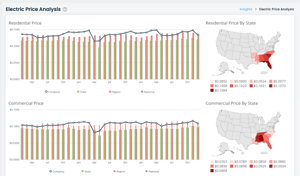
- Electricity Prices by Customer Class
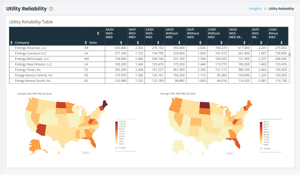
- Utility Reliability
- Power Plant & Utility Generation Capacity
- Transmission Lines & Substations
Midstream Energy
- Operations & Maintenance Expenses
- Oil Cost of Service
- Return on Rate Base
- Pipeline & Shipper Contract Information
- Gas Transportation & Storage
- Gas Pipeline Utilization
CASE STUDY
Southern Company Expedites Data Analysis & Increases Efficiency with HData
For Southern Company, work that took weeks is now tackled in just minutes. Learn how the utility’s finance department uses HData to create custom metrics for comparative analysis, significantly reducing the need to spend time on repetitive data-input tasks.